Social Drivers of Health Dashboard
The Missouri Department of Health and Senior Services (DHSS) Social Drivers of Health Dashboard is designed to leverage data to address health disparities in Missouri. This dashboard can be a resource for local public health agencies, community organizations, policymakers, and Missouri citizens. The dashboard intends to make data easily accessible to stakeholders and citizens so that all Missourians can achieve optimal health and safety in their communities for life.
FAQ for Social Drivers of Health Dashboard
Why does the dashboard use ACS 5-Year Estimates Data?
The majority of the data in the dashboard (excluding data on homelessness) comes from the Census Bureau’s American Community Survey (ACS) 5-Year Estimates. The ACS 5-year estimates are based on data collected over a 5-year period and therefore, represent the average characteristics for that entire 5-year time period. This data is best used when we are analyzing smaller geographies. One-year estimates are not available for geographies with population less than 65,000; since the majority of Missouri counties have populations below 65,000, the 5-year estimates are used for both county numbers as well as state numbers to stay consistent.
How do I interpret the Year when using ACS 5-Year Estimates Data?
The ACS 5-year estimates represent the average characteristics for that entire 5-year time period. Throughout the dashboard, when selecting a year in the “Select Year” dropdown, each year displayed is the latest year in the 5-year estimate and would actually represent an average number of the past five years. For example, the 2022 data would be using the 2018-2022 ACS 5-year estimates and therefore the data presented is an average of the 2018-2022 time period, the Year 2021 represents 2017-2021, Year 2020 represents 2016-2020, etc.
*This is the case for all of the data on the dashboard excluding data on Homelessness.
What constitutes the population in group quarters and how does the data for individuals in group quarters effect the ACS data throughout the dashboard?
It is important to note that the population in group quarters was included in the American Community Survey from 2006 and beyond. A group quarter is a place where people live or stay in a group living environment which is owned or managed by an entity that provides housing and/or services for the residents. Group quarters include places such as college residence halls, residential treatment centers, skilled nursing facilities, group homes, military barracks, correctional facilities, workers’ dormitories, and facilities for people experiencing homelessness. There are two types of group quarters: institutional and non-institutional. Institutional group quarters include facilities such as correctional facilities, nursing homes, or mental hospitals. Examples of non-institutional group quarters are college dormitories, miliary barracks, group homes, missions, or shelters. Some types of group quarters population have indicator distributions that are different than the household population.
Why is some of the data suppressed?
Some of the data points on the county maps throughout the dashboard may be suppressed. Internal analysis was used to determine the appropriate level of suppression in order to ensure the reliability of the percentage estimates. The suppression rule is triggered if the population for a demographic breakout (the denominator in the percentage calculation) was less than 100.
What classifies as being a “high school graduate or higher”?
Those whose highest degree completed was a high school diploma or equivalent (GED or alternative credential), individuals who attended college but did not receive a degree, and those who received an associate’s, bachelor’s, master’s, or professional or doctorate degree are included in the “high school graduate or higher” category displayed on the dashboard. Those who reported completing the 12th grade but not receiving a diploma are not included in this category.
What data limitations exist for this indicator?
The inclusion of the population in group quarters data could have an impact on the educational attainment distribution, especially in areas with a considerable group quarters population. More information on Group Quarters data is found in the Things to Consider for all ASC Data Frequently Asked Questions section.
What is Median Household Income and how is it calculated?
Median household income divides the income distribution into two equal parts: one-half of the cases falling below the median income and one-half above the median. Median household income is rounded to the nearest dollar. Median income, for households, is based on the distribution of the total number of households including those with no income and is calculated on the basis of a standard distribution. (More information on the standard distribution can be found on pages 162-164 of the following pdf American Community Survey and Puerto Rico Community Survey 2022 Subject Definitions)
What data limitations exist for this indicator?
Since answers to questions about income are often based on the memory of the respondent, many individuals tend to forget minor or sporadic sources of income, and, as a result, underreport their income. Underreporting tends to be more prominent for income sources such as public assistance, dividends, and net rental income.
How is the Poverty Percentage in the dashboard calculated?
The poverty percentage displayed in the dashboard is calculated by taking the number of individuals below poverty level (numerator) divided by the population for whom poverty status is determined (denominator).
For whom was poverty status determined?
Poverty status is determined for all people except institutionalized individuals (such as those in prison or nursing homes), people in military group quarters, people in college dormitories, those in living situations without conventional housing (and who are not in shelters), as well as unrelated individuals under 15 years old (such as foster children). These groups were excluded both from the numerator and denominator when calculating poverty rates.
How does the United States Census Bureau Determine Poverty Status?
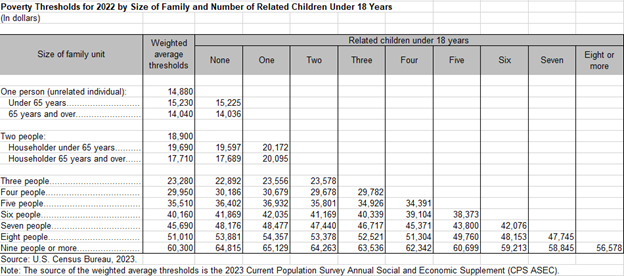
The Census Bureau uses a set of dollar value thresholds that vary by family size and composition to determine poverty status. The Census Bureau uses a matrix consisting of family size (ranging from one person to nine or more people) cross-classified by the presence and number of family members under 18 (ranging from no children present to eight or more) to determine the threshold. Further, poverty thresholds for people living alone or with nonrelatives (unrelated individuals) vary by age (under 65 years or 65 years and older). The poverty thresholds for two-person families also vary by the age of the householder.
What variables go into determining poverty status?
To determine an individual’s poverty status, the total family income in the last 12 months is compared to the poverty threshold appropriate for that person’s family size and composition. If the total income of that individual’s family is less than the threshold appropriate for that family, then that individual is considered “below the poverty level” in addition to every member of their family. Families as well as unrelated individuals with incomes in the last 12 months below the poverty threshold make up the total number below the poverty level.
What are Poverty thresholds and what is Missouri’s Poverty threshold for 2022?
Poverty thresholds are the dollar amounts used to determine poverty status. Thresholds vary by the size and age of family members, however, the same thresholds are used throughout the United States and are updated annually for inflation using the Consumer Price Index for All Urban Consumers. As of 2022, Missouri’s poverty threshold matrix looks like the following according to the United States Census Bureau:
What data limitations exist for this indicator?
There is a part of the group quarters population that is counted in the poverty universe (e, g,. individuals living in groups home or those in agriculture workers’ dormitories). Individuals that are a part of these group quarters populations are often times more likely to be in poverty than those living in households. The Census Bureau advises “Direct comparisons of the data would likely result in erroneous conclusions about changes in the poverty status of all people in the poverty universe”. (American Community Survey and Puerto Rico Community Survey 2022 Subject Definitions, p 119)
More information on Group Quarters data is found in the Things to Consider for all ASC Data Frequently Asked Questions section.
What qualifies as receiving SNAP?
The Census Bureau identifies an individual as receiving SNAP if they or any other current household member(s) received SNAP benefits during the past 12 months.
What data limitations exist for this indicator?
The inclusion of the population in group quarters could have an impact on the SNAP distribution, especially in areas with a considerable group quarters population. More information on Group Quarters data is found in the Things to Consider for all ASC Data Frequently Asked Questions section.
What is classified as unemployed?
To determine employment status, the U.S. Census Bureau sets a reference week when interviewing survey respondents. The reference week is always the week prior to the week the interview is being conducted; some questions specify a time period that differs from the reference week. All individuals aged 16 years and older are classified as unemployed if they meet all the following criteria set by the Census Bureau:
- Neither “at work” nor “with a job but not at work” during the reference week
- Actively looking for work during the last 4 weeks
- Available to start a job during the reference week
Additionally, individuals are included in the unemployed group if they are either not working at all during the reference week; available for work except for temporary illness; or returning to a job from which they had been laid off in the next 6 months or another specified return date.
What is classified as the labor force?
The U.S Census Bureau defines the labor force as all individuals in the civilian labor force plus members of the U.S. Armed Forces. The civilian labor force is comprised of all employed and unemployed individuals, excluding institutionalized individuals and U.S. Armed Forces active-duty members.
How are individuals who cannot work classified?
Those who cannot work are classified as “not in labor force” rather than unemployed. This category encompasses all people aged 16 years and older who are not classified as members of the labor force based on the criteria set by the Census Bureau used to determine employment status. The “not in labor force” category consists mainly of students, homemakers, retired workers, seasonal workers, institutionalized individuals, and disabled individuals.
What are the data limitations for this variable?
- The number of unemployed individuals may be overstated because people with irregular or unstructured jobs sometimes report themselves as not working.
- Additionally, the reference for employment data is not the same for all respondents. Since individuals may change their employment status from week to week, the lack of a standard reference week may mean that employment data do not reflect the reality of the employment situation of any given week.
- All institutionalized individuals are placed in the “not in labor force” category. Therefore, the inclusion of the Group Quarters data in this indicator could have an impact on the unemployment status distribution, especially in areas with a considerable Group Quarters population. For example, it would be expected to see the employment rate decrease in areas with a large state prison population due to the fact that the denominator of the percentage, which now includes the population in correctional institutions, is larger.
What types of insurance qualify an individual as “insured”?
There are seven types of insurance that qualify a person as “insured” according to the U.S Census Bureau. An individual is considered “insured” whether they are solely insured by any of the qualifying types or they have a combination of coverages. The qualifying insurance types are:
- Employer-based or union-based insurance from a current or former employer
- Insurance purchased directly from an insurance company
- Medicare
- Medicaid or any other government-assistance plan for low-income or disabled individuals
- TRICARE or other military health care
- Veterans Affairs (VA) health care
- Any other type of health insurance or health coverage plan (such as a non-employer-based marketplace plan)
What does it mean to be “uninsured”?
The Census Bureau identifies a person as “uninsured” if they either reported no health coverage or their only health coverage was Indian Health Service.
What data limitations exist for this indicator?
- The population used for the health insurance coverage estimates displayed in the dashboard is the civilian non-institutionalized population. This excludes active-duty military personnel and the population living in institutional group quarters (e.g., correctional facilities and nursing homes) but includes the population in non-institutional group quarters (such as college dormitories). Examples of the differences between institutional and non-institutional group quarters are listed in the Things to Consider for all ASC Data Frequently Asked Questions section.
- Populations in some non-institutional group quarters have health insurance coverage distributions that are different than the household population. For example, the prevalence of private health insurance among residents of college dormitories is higher than the household population. As a result, those in non-institutional group quarters could have an impact on the estimates of health insurance coverage.
- The population in institutionalized group quarters also may have different health insurance coverage distributions compared to those in the civilian non-institutionalized population, therefore the distributions/ percentages presented in the dashboard may differ slightly from how they would look if the total population were represented.
How does the United States Department of Housing and Urban Development (HUD) define homelessness?
HUD defines homelessness as “lacking a fixed, regular, and adequate nighttime residence” The 2023 Annual Homelessness Assessment Report (AHAR) to Congress
Who would be considered homeless using the HUD Definition?
- Individuals or families who are sleeping primarily in a public or private place that is neither designed nor typically used for that purpose. Examples would include those sleeping in cars, parks, abandoned buildings, bus stations, airports, etc.
- An individual or family living in a supervised shelter. These shelters are designated to provide temporary housing and can be either publicly or privately operated. Examples would include congregate shelters, transitional housing, or hotels/motels paid for by charitable organizations or government programs.
Who would not be considered homeless using the HUD Definition?
- Those residing in housing programs such as Permanent Support Housing (PSH) or Other Permanent Housing (OPH) programs
- Those in a location not listed on the Housing Inventory Count (HIC)
- Those living with relatives or friends temporarily
- Those living in housing they rent or own
What are point-in-time counts?
Point-in-time (PIT) counts are one-night estimates that typically occur during the last 10 days in January of each year. This metric estimates both sheltered and unsheltered populations on a single night. To be included in the PIT count, a person must be lacking a fixed, regular, and adequate nighttime residence to meet the definition of homelessness set by the United States Department of Housing and Urban Development (HUD).
Sheltered vs. Unsheltered
HUD defines sheltered homelessness as people who are staying in emergency shelters, transitional housing programs, or safe havens. Unsheltered homelessness is defined by HUD as people whose primary nighttime location is a public or private place not designated for, or ordinarily used as, regular sleeping accommodations for people.
What is the reason for the data irregularities seen in the dashboard for 2021?
Due to the COVID-19 pandemic, HUD waived some of the unsheltered PIT count requirements in 2021 for communities that determined conducting those counts posed too high a risk of COVID-19 transmission. As a result of the waived requirements, only 39% of all communities conducted full PIT counts that included all data elements for both sheltered and unsheltered populations. Additionally, capacity of homeless service providers was drastically impacted during the pandemic, but this reduced capacity was only reported through the Housing Inventory Count in some communities and not others.
What data limitations exist for this indicator?
- Data on homelessness is inherently difficult to capture due not only to the transient nature of the population but also some limitations of the methodologies used. Due to the myriad of locations at which an unsheltered individual could be staying, it is difficult to find and count all homeless individuals.
- Seasonal changes in homelessness are not captured due to the PIT count only taking place in January.
- HUD has a variety of approved methodologies for conducting PIT counts, but each community makes discretionary choices among the approved HUD methodologies. Therefore, no universal method is used to collect PIT count data which can result in inconsistencies across communities.
- Only individuals that meet HUD’s definition of homelessness are included in the PIT counts. Based on HUD’s definition, only some types of homelessness are counted.
Population Data:
U.S. Census Bureau. (2018-2022). Hispanic or Latino Origin by Race. American Community Survey, ACS 5-Year Estimates Detailed Tables, Table B03002. Retrieved July 17, 2024.
Unemployment Data:
U.S. Census Bureau. (2018-2022). Employment Status. American Community Survey, ACS 5-Year Estimates Subject Tables, Table S2301. Retrieved July 17, 2024.
Uninsured Data:
U.S. Census Bureau. (2018-2022). Selected Characteristics of Health Insurance Coverage in the United States. American Community Survey, ACS 5-Year Estimates Subject Tables, Table S2701. Retrieved July 17, 2024.
Poverty Data:
U.S. Census Bureau. (2018-2022). Poverty Status in the Past 12 Months. American Community Survey, ACS 5-Year Estimates Subject Tables, Table S1701. Retrieved July 17, 2024.
Median Household Income Data:
U.S. Census Bureau. (2018-2022). Income in the Past 12 Months (in 2022 Inflation-Adjusted Dollars). American Community Survey, ACS 5-Year Estimates Subject Tables, Table S1901. Retrieved April 25, 2024.
SNAP Data:
U.S. Census Bureau. (2018-2022). Food Stamps/Supplemental Nutrition Assistance Program (SNAP). American Community Survey, ACS 5-Year Estimates Subject Tables, Table S2201. Retrieved July 15, 2024.
Housing Data:
de Sousa, T., Andrichik, A., Prestera, E., Rush, K., Tano, C., & Wheeler, M. (2023, December). The 2023 Annual Homelessness Assessment Report (AHAR) to Congress. 2023 AHAR: Part 1 - PIT Estimates of Homelessness in the U.S. | HUD USER.Educational Attainment Data:
U.S. Census Bureau. (2018-2022). Educational Attainment. American Community Survey, ACS 5-Year Estimates Subject Tables, Table S1501. Retrieved July 17, 2024.